It takes a lot of fortitude to use them but I think the signals blog is proving itself useful.
For example, right now we seem to have established a bottom in the recent AUDJPY downward movement.
So, especially under such a condition, we get good results if we see a signal and then look for confirming behavior. Basically, the signals are great lead-ins to a period of analysis.
No, they aren't all useful. As you would expect there will often be signals that are simply useless. The key point is that you don't have to be watching the markets all day long to take advantage of signals. You can simply fire up the charts and issue a yes or no decision several bars after they arrive.
Showing posts with label alerts. Show all posts
Showing posts with label alerts. Show all posts
Thursday, November 5, 2009
Da Signals

Monday, June 29, 2009
Alert: AUDJPY Head And Shoulders?
I've spent most of today scalping the AUDJPY (on the long side).
Jumping up to my 3hr and 4hr charts, as I have two platforms running, I see an upside down head and shoulders.
You may want to take a look at this and see what you think.
Thursday, April 23, 2009
AUDJPY: Short On Failure?
It might be time to think about shorting the AUDJPY.
It's coming up to a recent high and might not have a lot of legs left.
If we get a decent failure there could be a shorting opportunity for some part of this evening.
See (on the 1 hour)?
Let's keep an eye on this...
... continuing ...
Down on the 1 minute chart we seem to have some resistance to get through before we have the ability to drop:
... continuing ...
Still on the 1 minute:
It's working the support and resistance (for now).
... continuing ...
This might, and I stress might, constitute a break of support in the 1 minute. The reason I'd consider it significant is that the 15 minute and 1 hour have strong stochastic and RSI values which may be ready to reverse soon.
Still watching.
... continuing ...
If I haven't messed up the lines we are definitely drawing outside of them on the 1 minute at this point:
Will it fire? The bollinger collapse is generally indicative that it will decide on a direction before too long. Don't forget, this is the 1 minute, so a move may not be all that huge unless it's the start of a move in a higher time frame.
... continuing ...
The 15 minute chart doesn't offer much encouragement:
We definitely have to see something conclusive to know what's going to happen. You could always straddle it -- though you'd risk a whipsaw.
... continuing ...
A quick spike, shown on the 15 minute chart, will tempt you to decide:
No failure here yet. Doesn't look promising does it?
I'm not giving up on the potential for this opportunity yet as each of my charts, the 1 minute, the 15 minute and the 1 hour, are all sitting around overbought levels. If the price doesn't get above it's recent high we could see a pullback.
And, yes, of course it could decide to blow right through resistance and throw the short idea to the scrap heap.
... continuing ...
Only 15 minutes left before the hourly chart moves to a new candlestick. This would be a good time for the market to decide what to do. If we hold at this price, but don't go much higher, then the stochastic and RSI would be in a real good position to roll over.
Still watching.
... continuing ...
Gah, no movement at all makes me paranoid! Here's the look of the 1 hour chart at the moment:
We have a touch... similar to an earlier touch that lead to a decline. This touch happens to be lower. We could get some movement. No promises, but we could.
... continuing ...
I'm not the only person thinking this. Here, on the 1 minute, you can see the downward drift as we near the turn of the hour:
Still no promises... maybe it's a feint.
... continuing ...
This, on the 1 hour chart, looks bearish to me. If it is, it could still take a hours to be clear:
Maybe I'll develop more patience through trading?
Perhaps the real move is based on a possible upside down head and shoulders pattern?
Nobody can really say.
Why am I following this idea? Well, if it's right, and it works out as good as might possibly be expected, it could end up being worth about 100 pips. That's worth a little bit of work. If I'm wrong, well, I lose a few pips if I'm tricked into thinking I'm right.
... continuing ...
It's looking a bit robust on the 1 hour:
Did I mention I love my new screen clipping tool?
... continuing ...
You know, if we continue to sit around and do nothing, except maybe fall just a little, we could end up with a tweezer top on the 1 hour:
Now, that I'd find bearish!
... continuing ...
The latest 1 hour looks a bit more promising -- not sure how long it will stay that way of course:
I'm going to buy myself a beer if I end up having read the short on failure action correctly.
... continuing ...
Well, shoot, a shiny new tweezer top type setup and no reaction. The tails must not be long enough. Stupid market, trix are for kids!
.. continuing ...
Just to finish off this post -- I have finally seen movement:
The lack of immediate gratification, and the lack of robust response, has taken some of the joy out of being somewhat correct.
AUDJPY: Look Who's Consolidating
Well, I should be sleeping, but since I'm not I thought I'd take another look at the charts.
Guess what -- it's the same chart but I see something new!
Okay, sure, a bit more time has passed. However, with the added points I clearly see that we seem to be consolidating.
There should be some money to be made while we bounce around... and then some money to be made when a direction is chosen.
As ever, things can change anytime... ;)
... continuing ...
Speaking of change:
Wednesday, April 22, 2009
AUDJPY: Decision Point
I'm looking at the 3HR chart at the moment. We seem to be looking at an impending strike on a recent support line.
If this resistance holds we might have a technical setup that would allow for a nice gain.
Take a look:
See how there was something of a W shape starting in the middle of the 19th? See how the chart is currently on the second touch down of a second W? If we bounce off the support line and "fire" the technical pattern, we could be in for another move towards the upper end of 72.
... continuing ...
However, be warned, the 1HR looks like a head and shoulders pattern riding along the support line:
... continuing ...
The 15 minute chart looks promising:
The question, as ever, is whether or not this will be backed up by future results.
... continuing ...
Also on the 15 minute chart:
Sure. Now what? It's always the nature of the game, risk vs opportunity.
Monday, April 20, 2009
AUDJPY: Decision Point
After the downward move, see the last post, we are now poised to either bounce off the previous low or sink down.
In other words, either result provides opportunity.
Here's another snap of the 1MIN showing the AUDJPY bouncing just above the recent low of 68.06 (as shown by the yellow support lines drawn under the candlesticks).
Take a look, make your call, set a good stop if you know how...
... continuing ...
We've got another little uptrend going. No telling whether or not we're going to get very far or not.
I've got an in-profit stop loss riding along with this to see how things turn out.
Sunday, April 19, 2009
AUDJPY: Breaking Trend?
Though I'm a bit leery of Sunday price action it looks like a fairly long term support line is being broken.
This could be interesting.
... continuing ...
Looking closer, this may not yet be a break, as there have been previous "breaks" which gives us a bit of leeway here. A redraw based on a previous "break" leaves a bit of breathing room still.
... continuing ...
Waking up at 5:30am I see that while I may have a long term bullish expectation it looks like we've had and/or are having some downward movement. I'm not going to look very closely right now -- I need to get back to sleep.
Friday, April 17, 2009
AUDJPY: Collapsing Bollinger
The range of price movements has been shrinking.
Or, as generally considered from a technical analysis point of view, the bollinger bands are collapsing.
Your guess is as good as mine as to the direction it will go, but usually when the bollinger bands collapse the currency will have completed it's consolidation and start a reasonable move up or down.
Given that it's a Friday I'd have to say be cautious. If people are nervous going into the weekend then they are likely to choose risk aversion, which is negative for carry trades.
My view... wait and see.
Thursday, April 16, 2009
AUDJPY: Some Upward Movement
Finally, after suggesting all day long that I'm looking for upward movement it's finally here.
How long will it last? Who knows. Will it hit the top of my so-called consolidation zone? Don't know.
Anyway, here's the latest from my chart...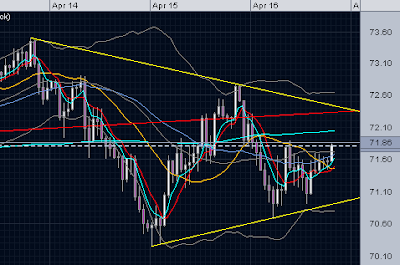
I'll be happiest if the pair zooms up like a rocket, but I'll lock in some profit if we get close to the resistance line.
AUDJPY: Slow Decline
I'm sitting here watching the slow, achingly slow, decline in the AUDJPY.
Based on RSI and stochastic evidence, not shown on the image below, it's very possible that we'll get an upturn soon.
Anyway, this image shows you that we are continuing to approach what I've called a containment field. It represents a possible consolidation zone while the market tries to figure out whether to ultimately head north or south.
Obviously, I'm bullish on the AUDJPY so I expect this to bounce. A lot of other people, on Twitter or elsewhere, seem to be bearish.
... continuing ...
If we do get a solid bounce, you'll notice that we'll have a double bottom in the right side of a W shape. I'd generally expect this to be bullish, but we have to figure that we'll be going into the Asian session before long. One possibility is a trouncing of the Yen while another is an increase in risk aversion -- generally bad for carry trades.
Thursday, October 23, 2008
AUDJPY Revisiting Lows
We're down below 63.00 in the AUDJPY market (as I type -- it may bounce).
This appears to be a test of the 5+ year low for this pair... google charts. Are we ready for a bounce and the much awaited eventual upward trend?
Obviously, I have no idea. However, you can be sure I'm sitting here watching the price action as I type.
Right now, we've bounced a bit and are setting up for a possible "tweezer pair" on the 15m chart. I'd consider that bullish if it happens and gets the expected reaction.
UPDATE: 11:15 has passed, we have two tailed candlesticks near the prior bottom, but I don't see the market rebounding as of yet. I have a small long position with a short stop loss very close to the bottom and, honestly, I wouldn't be surprised by a false downward stab to take out my position before any sustained upward movement.
UPDATE: 11:24. We've pushed down a few extra pips, but we haven't snapped through the resistance at this point yet. With a long position on the table I'd like to avoid pushing an extra pip or two as it encourages the bears and increases the risk of overcoming available support.
UPDATE: 11:30. We moved back and forth between a tailed candlestick and closing near the bottom of the candlestick a few times. We ended up with another reasonable tail length -- I guess I shouldn't be calling them "long tails" per se. In any case, if we can get a bit of upward movement after these failed downward pushes it might scare off some bears.
UPDATE: 11:33. I really shouldn't be watching if I wanted a stress free life, but I've got a stop loss in place so this is no big deal. Anyway, we're pushing downwards again, and I'm hoping we can stop a few pips short of the last downward push. Extending by a pip here and there, as we just did again (11:34), greatly raises the risk of a downward breakout. And here it is.. how far will it go?
UPDATE: 11:38. I'm not sure where we can expect to go right at the moment. I'd say that if we don't have commodity prices recovering and/or we don't have global markets moving upwards then we can expect further downward movement towards some as yet to be found bottom.
UPDATE: 11:59. We have what looks to be a nice long tail on the 1hr chart. This could be an interesting development.
UPDATE: 1:27. Another downward break. Presumably not a surprise to most!
Wednesday, September 3, 2008
EURAUD Head And Shoulders?
Are you a Forex carry trader?
Don't look now but the EURAUD has completed two out of three components of a head and shoulders pattern on the hourlies.
You might want to be on the lookout for this over the next several hours. If it activates it could spell a nice downward move for this carry pair.
Thursday, February 21, 2008
Potential AUD/JPY Double Top
It's hard to say whether it will complete or not, but the 1hr chart is showing the potential to make a nice visible double top by the end of today.
As I'm sure my readers know... the AUD has had a nice run lately based on speculation that the RBA will be raising interest rates. However, the AUD/JPY pair has bounced back from attempts to get beyond 99.60 during this week.
We should start to expect either a break above this level or the formation of a double top, which could potentially lead to several hundred pips worth of decline.
Subscribe to:
Posts (Atom)

