If you've been following along you'll notice that I keep mentioning that I am long term bullish on the AUDJPY.
One of the reasons is that I think we've seen the worst of the panic and risk aversion. Another reason is that I think we're now closer to a recovery and following period of economic expansion than a lot of people expect.
Given these two thoughts, and the following chart, it's easy to see why I expect a slow return to higher AUDJPY prices;
However, what appears to be a large double bottom over a period of months does little to tell us what the price will be doing in the short term. The following 3HR chart shows us that we might be at a critical juncture:
The resistance line is spot on since early March. The support line is a bit spottier and appears to be in the midst of being tested. If you've kept your powder dry this might be a good time to figure out how to play upcoming moves over the next week.
Flipping to the one hour we see the consolidation trend that I was talking about at the end of last week:
Given my overall expectation of a long term upward trend, and the fact that the lower line in the 1HR has been active for a couple months, I'm apt to speculate on a new leg in the upward journey.
Don't forget, if you make big bucks because of my blog, feel free to hit the donate button. If you lose your shirt, you are on your own! ;)
Sunday, April 19, 2009
AUDJPY: Weekend Analysis

Saturday, April 18, 2009
EURUSD: Weekend Analysis
I don't generally trade the EURUSD but since it's the weekend I seem to have some extra time on my hands.
Here are a series of charts, in varying timeframes, that I'd use to get a general feel for this currency pair.
First, let's look at the 1D chart to see what's happened over the long term. I've compressed the chart a fair amount in order to get it to fit into a single snapshot -- you should be able to click to expand the image:
First, notice that over this period there has been an apparent double bottom. In fact, I've drawn a trend line to help identify this. As well, the currency pair has not yet broken above a resistance line drawn from the middle of July until now. In the big picture I'd expect the price to bounce around between these lines until a major news event or until the lines have converged.
Frankly, I'm not sure what will happen to the Eurozone or North America with respect to economic growth and interest rates, so I refuse to try to call which direction a long term breakout will go. However, that doesn't mean you can't speculate on either or both directions.
Moving to the 3HR, below, it looks like we might be able to fall a bit, but more importantly, we've broken a recent support point:
Notice the horizontal yellow support line that has been breached? If I were going to put money into this market I'd be thinking that we've got some room to drop. Don't get me wrong, it certainly doesn't have to, but often a support or resistance breach is a prelude to further movement in that direction.
On the 1HR chart, I see something that looks like a setup to me. See how the price appears unwilling to break the lower red support line? If I were going to play EURUSD I might wait to see if the currency makes it's way back to upper resistance line and then short the pair:
It's easy to call shots on the weekend and obviously when the markets open on Sunday this could all be trash due to news of some type. However, until things get shifted in some major way I'd either try to counter-trend a long position back upwards or simply wait for the short setup that seems suggested after a move back up.
Finally, this is not advice, and I could very well be completely out to lunch. However, this is my take on the situation. You should simply consider this one interpretation. Obvious weak points, from other points of view, are previous highs and lows as resistance levels, Fibonacci points, and so on.
AUDJPY: Weekend Recap
I don't really have anything new to add since Forex markets are closed for the weekend.
We are still constrained within what appears to be a consolidation pattern. We are approaching the end of the pattern and the bollinger bands on my 1hr chart are collapsing.
I've also got a nifty new screen snipping tool that I wanted to try out... ;)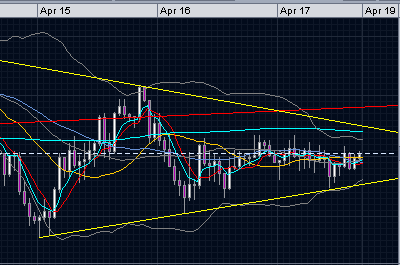
While I do remain long term bullish there is a lot of noise in the markets about a need for correction given the recent run on wall street. A correction, or a return to risk aversion, has a high probability of forcing down the AUDJPY.
Friday, April 17, 2009
AUDJPY: Collapsing Bollinger
The range of price movements has been shrinking.
Or, as generally considered from a technical analysis point of view, the bollinger bands are collapsing.
Your guess is as good as mine as to the direction it will go, but usually when the bollinger bands collapse the currency will have completed it's consolidation and start a reasonable move up or down.
Given that it's a Friday I'd have to say be cautious. If people are nervous going into the weekend then they are likely to choose risk aversion, which is negative for carry trades.
My view... wait and see.
AUDJPY: Now What?
Well, we didn't really do much at all yesterday after bouncing off of a support line a couple of times.
What does this mean?
This means that the AUDJPY currency pair isn't currently behaving in a way that makes it easy to interpret. This means that we need to be careful.
I have no idea what the market will do... except that it will either go up or down at some point.
Thursday, April 16, 2009
AUDJPY: Some Upward Movement
Finally, after suggesting all day long that I'm looking for upward movement it's finally here.
How long will it last? Who knows. Will it hit the top of my so-called consolidation zone? Don't know.
Anyway, here's the latest from my chart...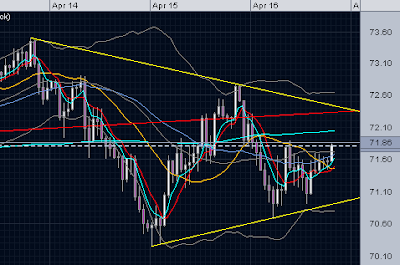
I'll be happiest if the pair zooms up like a rocket, but I'll lock in some profit if we get close to the resistance line.
AUDJPY: Still In Consolidation Range
I didn't have time to post another update during the day, but things have been pretty slow anyway.
Here you can see that the AUDJPY has not yet broken out of the trend lines (that I have shown in early charts).
I'm not sure what is going to happen during the Asian session, but as ever, I'm hoping for some bullish action.
I'm sure you can see the market honoring the trend line by bouncing off it?
AUDJPY: Slow Decline
I'm sitting here watching the slow, achingly slow, decline in the AUDJPY.
Based on RSI and stochastic evidence, not shown on the image below, it's very possible that we'll get an upturn soon.
Anyway, this image shows you that we are continuing to approach what I've called a containment field. It represents a possible consolidation zone while the market tries to figure out whether to ultimately head north or south.
Obviously, I'm bullish on the AUDJPY so I expect this to bounce. A lot of other people, on Twitter or elsewhere, seem to be bearish.
... continuing ...
If we do get a solid bounce, you'll notice that we'll have a double bottom in the right side of a W shape. I'd generally expect this to be bullish, but we have to figure that we'll be going into the Asian session before long. One possibility is a trouncing of the Yen while another is an increase in risk aversion -- generally bad for carry trades.
AUDJPY: Don't Cross The Streams!
It looks like we are going to test the containment of the possible AUDJPY consolidation zone I mentioned previously.
Frankly, I had expected the market to hold up better to the news concerning jobs and housing, but then, if I could accurately predict what would happen I wouldn't be speculating would I?
In any case, if we get an upward bounce around 70.75 - 70.85 then we are still in what I consider the containment zone. This doesn't prove anything, but it does mean the lines on my chart are still useful guidelines for suggesting entry and exit points.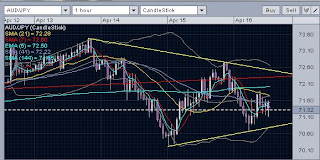
If it doesn't hold, then we'll see about retesting some recent lows.
Each of them gives us a possible bounce point or release down to the next possible support point.
AUDJPY: Risk Aversion
It's likely, with the bad jobs and housing starts news this morning, that risk aversion will come into play.
Basically, the AUDJPY is a good indicator of fear in the markets these days.
With all that said, I'm still going to watch closely for a bounce of the potential support line. That is likely to be the point that the market decides to rally or collapse for the day.
... continuing ...
I don't see that the market was pricing in a recovery already. There are starting to be some signs that things aren't in a free-fall. The fact that jobs and housing starts aren't good should be a surprise to nobody.
Anyway, what I'm suggesting is that the news may look bad to those that started to buy into a recent rash of good news, but realistically, anyone who knows anything about markets should be waiting on the sidelines to swoop in.
Oops, you can see my upward bias showing again can't you?
AUDJPY: Possible Consolidation?
It's nearly 9:00am EST and we didn't drop low enough to get a real double bottom. We may have begun a consolidation process between 73.50 and 70.25 while the market figures out whether the next move is up or down.
We'll have to see whether we continue to have lower highs and higher lows.
If we are consolidating, then it's not hard to spot the support and resistance lines that will be likely to provide opportune long and short entry points.
In short, opportunities for doubles, possible consolidation, and so on. Personally, I have a long term upward bias -- so take any of my opinions with that grain of salt.
EDIT: By the way, I'm generally looking at the 1hr when doing analysis.
