Here are a series of charts, in varying timeframes, that I'd use to get a general feel for this currency pair.
First, let's look at the 1D chart to see what's happened over the long term. I've compressed the chart a fair amount in order to get it to fit into a single snapshot -- you should be able to click to expand the image:

First, notice that over this period there has been an apparent double bottom. In fact, I've drawn a trend line to help identify this. As well, the currency pair has not yet broken above a resistance line drawn from the middle of July until now. In the big picture I'd expect the price to bounce around between these lines until a major news event or until the lines have converged.
Frankly, I'm not sure what will happen to the Eurozone or North America with respect to economic growth and interest rates, so I refuse to try to call which direction a long term breakout will go. However, that doesn't mean you can't speculate on either or both directions.
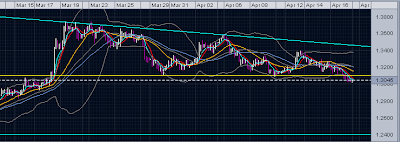
Moving to the 3HR, below, it looks like we might be able to fall a bit, but more importantly, we've broken a recent support point:

Notice the horizontal yellow support line that has been breached? If I were going to put money into this market I'd be thinking that we've got some room to drop. Don't get me wrong, it certainly doesn't have to, but often a support or resistance breach is a prelude to further movement in that direction.
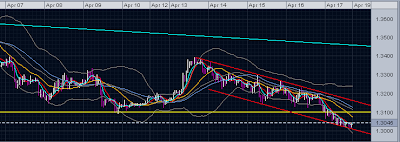
On the 1HR chart, I see something that looks like a setup to me. See how the price appears unwilling to break the lower red support line? If I were going to play EURUSD I might wait to see if the currency makes it's way back to upper resistance line and then short the pair:

It's easy to call shots on the weekend and obviously when the markets open on Sunday this could all be trash due to news of some type. However, until things get shifted in some major way I'd either try to counter-trend a long position back upwards or simply wait for the short setup that seems suggested after a move back up.
Finally, this is not advice, and I could very well be completely out to lunch. However, this is my take on the situation. You should simply consider this one interpretation. Obvious weak points, from other points of view, are previous highs and lows as resistance levels, Fibonacci points, and so on.

No comments:
Post a Comment