Showing posts with label charts. Show all posts

Saturday, November 3, 2012

Longer Term Charts

Recently, Oanda has added a weekly period to their proprietary trading platform. As you can imagine this thing is not very exciting to watch on an active basis. However, I think there is predictive value available here.

For example, though it is difficult to catch a top or a bottom at this level of observation you can certainly see longer term bollinger events. Here is what looks like a bounce on the CADCHF.


A retest of recent highs near 0.9950, if that happens, will put 500 pips on the table. Is it worth waiting a month or more to earn some of that? Alternately, if you expect it is going to get back near those highs do you think there will be some excellent buying chances over the next month as price works its way there?

You bet!

The longer term play might involve a smaller position. You'd have to be willing to take the chance that news events will change the course of action and possibly be willing to endure hundred pip losses for weeks.

The shorter term plays, perhaps on the 1 day, 4 hour or 1 hour might be a bit more lucrative. If you are fairly certain you know what direction the price will be moving and the charts provide a nice entry setup then you may choose to put a bigger position into play for a relatively short period of time.

Just be careful. Long term charts can move a long way in the wrong direction even if you are ultimately proven right. You'll need discipline to hold on and to let go at the appropriate times.

Tuesday, December 15, 2009

AUDJPY: Technical Analysis

Well, my posts are few and far between these days.

In case anyone else is still following long here is some good information on the 3hr AUDJPY.

We have a nice symmetric triangle going all the way back to November 25th.

See?


I'm expecting this to break (upward) and then run into a downward sloping resistance line on the 1d AUDJPY. However, we'll have to wait and see. I've been wrong (more than a few times) before.

UPDATE: Here we have the price dropping, on the 1hr, giving us a good entry point. We can easily set a stop loss relatively close while targeting the upper boundary for profit. However, as there was news earlier, we may find that the support line yields to changed market expectations.


UPDATE: The bar isn't closed on the 1hr but it's almost 11:00pm ET and it looks like we are breaking downward at the moment.

Tuesday, November 10, 2009

AUDJPY: Support Becomes Resistance

My last post showed a profitable overnight setup based on a week long support line on the 1hr chart.

Here, I've got an example of a support becoming resistance once it has been violated.

Take a look at the following 15min chart:


See the violation around 9:00pm last night? As an aside, this was a good point to try a well protected short. Overnight we tested a longer term support line (see my previous two posts) which held.

Finally, notice that recently this previous support line held as resistance just before 6:00am. I do expect it to be violated as the longer term support held -- but obviously we'll have to wait and see.

Sunday, November 8, 2009

AUDJPY Forecast

What the heck, I may as well jump out on a limb and let you know what I'm seeing with the AUDJPY.

Basically, if you look at the chart, we've had a good support line since the beginning of November.

Now, if I've got the right chart uploaded, take a look below:


Personally, I'd suggest taking a long position when the price approaches the support line. You can set a nearby stop and protect yourself from much by way of downside risk.

The only issue, for me, is that Sunday trading seems a bit wild at times.

UPDATE: Well, I hope somebody played the bounce...


It was worth it.

Sunday, October 18, 2009

AUDJPY: October Trend

The AUDJPY has been on an upward trajectory for a while now.

There is no telling, at least not in advance, whether we'll see more massive upward movement due to hawkish statements from the RBA or not.

However, here is a 3hr chart showing recent movements:


Obviously, clear support and resistance helps identify some lower risk entry points.

Thursday, October 8, 2009

Skeptical About The AUDJPY?

I'm sorry you feel that way. Perhaps after looking at the following chart snip you'll think that you may have missed the boat.

See how the daily chart shows solid support since March? March! Hello, it's a little too late to be skeptical. The question you have to ask yourself is why has the AUDJPY been performing so well and how long will it continue to do so.


On another note, I'm going to start posting "signals" to a companion blog soon... perhaps as early as next week. I've already created the blog. These won't quite be signals but they will be alerts suggesting points of opportunity.

Saturday, April 18, 2009

EURUSD: Weekend Analysis

I don't generally trade the EURUSD but since it's the weekend I seem to have some extra time on my hands.

Here are a series of charts, in varying timeframes, that I'd use to get a general feel for this currency pair.

First, let's look at the 1D chart to see what's happened over the long term. I've compressed the chart a fair amount in order to get it to fit into a single snapshot -- you should be able to click to expand the image:

EURUSD 1hr Jul 08 to Apr 09
First, notice that over this period there has been an apparent double bottom. In fact, I've drawn a trend line to help identify this. As well, the currency pair has not yet broken above a resistance line drawn from the middle of July until now. In the big picture I'd expect the price to bounce around between these lines until a major news event or until the lines have converged.

Frankly, I'm not sure what will happen to the Eurozone or North America with respect to economic growth and interest rates, so I refuse to try to call which direction a long term breakout will go. However, that doesn't mean you can't speculate on either or both directions.

Moving to the 3HR, below, it looks like we might be able to fall a bit, but more importantly, we've broken a recent support point:

EURUSD 3hr
Notice the horizontal yellow support line that has been breached? If I were going to put money into this market I'd be thinking that we've got some room to drop. Don't get me wrong, it certainly doesn't have to, but often a support or resistance breach is a prelude to further movement in that direction.

On the 1HR chart, I see something that looks like a setup to me. See how the price appears unwilling to break the lower red support line? If I were going to play EURUSD I might wait to see if the currency makes it's way back to upper resistance line and then short the pair:


It's easy to call shots on the weekend and obviously when the markets open on Sunday this could all be trash due to news of some type. However, until things get shifted in some major way I'd either try to counter-trend a long position back upwards or simply wait for the short setup that seems suggested after a move back up.

Finally, this is not advice, and I could very well be completely out to lunch. However, this is my take on the situation. You should simply consider this one interpretation. Obvious weak points, from other points of view, are previous highs and lows as resistance levels, Fibonacci points, and so on.

Thursday, April 16, 2009

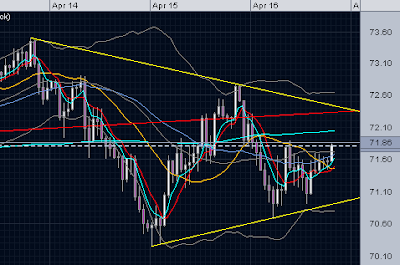
AUDJPY: Some Upward Movement

Finally, after suggesting all day long that I'm looking for upward movement it's finally here.

How long will it last? Who knows. Will it hit the top of my so-called consolidation zone? Don't know.

Anyway, here's the latest from my chart...

Look, It's Going Up
I'll be happiest if the pair zooms up like a rocket, but I'll lock in some profit if we get close to the resistance line.

AUDJPY: Still In Consolidation Range

I didn't have time to post another update during the day, but things have been pretty slow anyway.

Here you can see that the AUDJPY has not yet broken out of the trend lines (that I have shown in early charts).

I'm not sure what is going to happen during the Asian session, but as ever, I'm hoping for some bullish action.

See The Bounce?
I'm sure you can see the market honoring the trend line by bouncing off it?

Wednesday, October 22, 2008

Betting Against The AUDJPY

Well, with commodity prices spiraling down the toilet, it's a good time to be short of the AUDJPY.

Look, put an SMA 20 on your AUDJPY chart. Load up the 1HR or 3HR chart. What direction is the simple moving average going?

That's the trend.

So, if the trend is your friend, what's the best direction to play?

You guessed it in one... down!

If you know how to draw a resistance line, or to put something like a CCI, Williams %R or even possibly a stochastic or RSI indicator then you should be able to pick relative high points to pal around with your friend the trend.

Heck, even the SMA or a set of Bollinger Bands will probably do the job.

Really, it can be that simple, at least while you have a clear trend.

Get your trades on!

Thursday, October 9, 2008

AUDJPY Technicals

I'm looking at my AUDJPY trend line.

We've seen some good movement, recovering from the recent meltdown in short order... probably due to the coordinated rate changes.

While I like the move I think we're getting to the top of our current trading channel. How we handle the reversal, assuming there is soon to be one, will set the tone of the next couple of days.

If we bounce back up on or before the lower trend line it should mean good things. Next week, of course, may be a different story.

P.S. Can't figure out where the bottom trend line is? Buy a book or something.

Friday, October 3, 2008

Seeing Beyond The Bailout

Now that the US bailout package has been passed the question on everyone's mind is what happens next?

Nobody knows. Conversely, everyone knows!

Once the question of government action has been answered we know that the currency markets will move either up or down. Basically, the only time they are in near stasis is when speculators and investors need the next piece of information in order to properly develop their expectations.

Okay, I know, you'd like some ideas to consider so that you can gather ammunition and make up your own mind.

My take is that the GBPJPY and AUDJPY are setting up for a possible double bottom on their 1d charts. The bailout package represents a reason for currency traders to accept a bit more risk. As I'm sure you know carry trade positions are liquidated during periods of risk aversion. Somebody, somewhere, is going to look at the exchange rates and decide that there are some deals.

I'm unsure which currency is more appealing. Both the UK and Australia appear to be in the process of relaxing fears with respect to inflation. When they drop interest rates their currencies won't react by appreciating in price.

However, the GBPJPY is extremely low in historic terms. Perhaps there is some inertia or general distrust of the cable that needs to be worked out, but you have to wonder how much further it can fall. Isn't somebody out there going to start considering goods and services from the UK competitively priced?

With respect to the AUDJPY, I can't imagine that Australia won't be able to sell commodities into Asia. Sure, currency prices may be falling, but the fall in the Australian dollar will leave exporters in a profitable position regardless. With this being the case -- how can Australia consider inflationary pressures to be abating?

Of course, I should note, speculation on macroeconomic fundamentals such as above is not a short term play.

So, what's my strategy?

I plan to accumulate carry trades during upswings. Sure, what upswings you might be wondering. If there aren't any, then I'll continue to wait. However, I expect to see them soon. Once these trades are profitable I'll place in-profit stop losses on them and open up new positions at opportune moments.

Looking at the long term as I am I see thousands of pips on the table. If I can accumulate more and more positions, under the protection of profitable stop losses, I could end up riding some serious profit. Of course, the hard part is not letting all my trades be shaken off when the market is bucking.

Wednesday, September 3, 2008

EURAUD Head And Shoulders?

Are you a Forex carry trader?

Don't look now but the EURAUD has completed two out of three components of a head and shoulders pattern on the hourlies.

You might want to be on the lookout for this over the next several hours. If it activates it could spell a nice downward move for this carry pair.

Tuesday, July 15, 2008

Day Trading and Scalping

Things are still going very well, but I have to admit I haven't been able to pick off huge gains this week. Not yet anyway.

Here's the scoop...

Sunday PM through Monday PM -- NAV +3.05%
Tuesday AM though Tuesday PM -- NAV +2.93%

This is okay, but I see large profits left on the table. It's strange, in order to make it easier to pick up pips I'm working on the 1M and 5M charts. This is pretty good for watching movement -- feeling the rhythm of market -- but it sucks for keeping in mind the larger picture. I can certainly see why people invest in trading stations with multiple large monitors.

Anyhow, to be clear, while the net asset value can be determined via unrealized profits and losses, I am closing all open trades at the end of each session. These are true, risk free at the time of reporting, NAV numbers.

I can't help but wonder if it would be easier to scalp and/or trade profitably if I was able to focus on this during business hours. Well, it would probably be easier to catch movement during the European session too. Things seem to get pretty quiet at times during the Asian session.

Finally, since I have a very high win percentage on scalp trades I am thinking of increasing the size of these trades. Would the psychology of risk start getting in the way if I did that? Probably. If not, it wouldn't be very hard to turn up the income quite a bit -- and I always assume that if things were that easy everyone would do it.

We'll see.

Saturday, June 7, 2008

Learning To Love Stochastics

Many of you trading in the Forex markets know that the difference between success and failure lies in the probabilities.

What is the probability that your speculation will be correct?

The more often that your positions are correct the more profitable you will be. This is part of the reason that so many bozos are busy promoting supposedly infallible commercial signals. Seriously, if their signals were infallible, why wouldn't they get rich trading on them instead of selling them to you for peanuts?

Something I've noticed recently is that stochastic indicators show a good correlation with spikes in price. Of course, this does not imply a one to one correlation, but if you are betting with the stochastic indicators you will simply find yourself on the correct side of a nice price move from time to time.

As I've said before, I'm also a fan of Bollinger bands... and they can certainly be used together.

Here's a simple strategy you can try. Pick a carry trade, such as AUDJPY, and consider buying it when the price touches the bottom Bollinger band. At the same time, ensure that the stochastic indicator is either at the bottom or just starting to come back towards the top.

The idea is to open a small position that you can afford to hold and carry, but to accept a profit if your position proves to be profitable. Remember, prices don't go in one direction forever, so don't be afraid to cash out your position -- without beating yourself up if you don't catch the top. It's about consistently making profitable trades not being the best at calling tops and bottoms!

Thursday, February 21, 2008

Potential AUD/JPY Double Top

It's hard to say whether it will complete or not, but the 1hr chart is showing the potential to make a nice visible double top by the end of today.

As I'm sure my readers know... the AUD has had a nice run lately based on speculation that the RBA will be raising interest rates. However, the AUD/JPY pair has bounced back from attempts to get beyond 99.60 during this week.

We should start to expect either a break above this level or the formation of a double top, which could potentially lead to several hundred pips worth of decline.

Saturday, February 9, 2008

No Time? No Problem!

I'm a lot busier than I was. I no longer have time to watch the forex markets full time in pursuit of profits.

So, as you can imagine, I've developed a new trading strategy.

A good way to figure out when to attempt to enter the AUDJPY is when the 1hr chart shows the price hitting or dropping below the lower Bollinger band. It won't always bounce up from that point, but very often it does.

Armed with this knowledge, it's easy to leave a 1hr chart up on the screen and from time to time glance at it to see if action is needed. Did the price hit the Bollinger? Bam, fire off a small purchase. Did the price bounce and re-hit the Bollinger? Bam, fire off another purchase.

If you are trading, you can set a take-profit with each purchase, or at least each purchase that you actually are able to execute (since if you are busy you will surely miss some of them). If you are trying to carry, you've picked fairly good places to enter and hope for a market rise.

The only problem is that it may be quite a while between opportunities. You may find yourself missing a lot of movement. However, that's the price you pay for not having time to watch the market with any serious time commitment.

Friday, January 25, 2008

Double Top Warning

It isn't here yet, and that means it may never arrive, but we are currently looking at a potential double top on the AUDJPY.

This means that the DOW could also be poised to give up some recent gains.

Obviously, the DOW can do what it wants, but if you are seeing gains right now and are thinking of jumping in, be wary.


Personally, I'm hoping for the downturn. If it happens according to "my" chart then it means that I'm able to take advantage of the movement. It also means that the AUDJPY will be "on sale" as it will eventually rise again. It will always rise again as long as the carry trade remains associated with the DOW.

UPDATE:

The rollover continues...


While anything can happen, ignore such signs at your own risk!

UPDATE:

I hope you were paying attention this morning...


The market has now made a double top and reacted to it. The DOW has followed/driven the AUDJPY (since I'm sure the overseas markets have a say in the matter too) and once again I have a strange feeling of "control" which is certainly misplaced.

Wednesday, January 23, 2008

Earning While Sleeping or Catching The Top

This morning I wake up to verify that I've made about 30% of the NAV (net asset value) of my downside trading sub-account. Sweet!

How did I do this?

I have been charting the AUDJPY for several days. There is a clear down trend and at 7:30pm last night the price touched the top of the trend. From there I'd been able to accumulate short positions, setting protective stop losses before opening up another position.

1hr AUDJPY with trend lines
Needless to say, I ended up with a large portion of my account value in sold positions, without assuming undue risk.

If the trend lines hold, and I hope they do, I'll be accumulating long positions at some point later today.

NOTE: The chart is a bit squished and perhaps complex, as I've got trend lines based on various high and low points, two different averages, one MACD, and some Bollinger bands. However, I've highlighted the significant top touch that set off my sell strategy.

Thursday, January 17, 2008

Thursday's Bernanke Dive

Well, as per my previous post, Bernanke maintains his negative signal status.

I'm happy to say I was trading the AUDJPY downwards today. I don't usually trade the downside, as I don't like the chance of being caught in a negative interest income position, but with Bernanke on the microphone, I just couldn't resist.

I also had some very well behaving trend lines on the 1hr and the 5min charts. With both charts suggesting a drop from top of trend to bottom of trend, and Bernanke speaking, I got in at the top and got out at the bottom as the day ended. A very nice day...

Profitability rating: ~10% NAV

If only I wasn't trading a nano account (when I'm profitable anyway)!